As Q2 came to an end, we analyse the actual data vs our forecast sector by sector, including latest developments going into Q3. We have also added updated peer tables for each sector.
Key takes:
- Oil Tankers (BUY) and Dry Bulk (BUY) in-line with our forecast
- LNG Carriers (BUY) rallying to unseasonal highs
- LPG Shipping (BUY) disappointed in 2Q18, but short-term improvements are underway.
Oil Tankers (BUY): As we expected
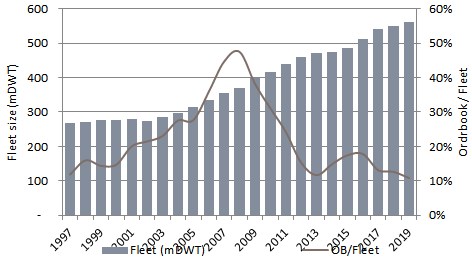
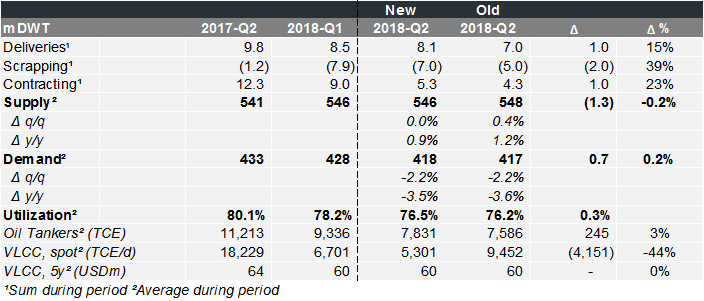
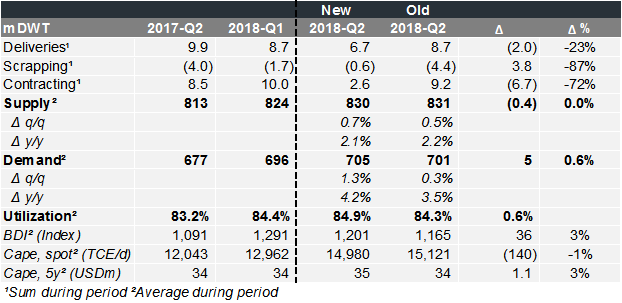
Q2 developed more or less in-line with our forecast from early May, with a net supply growth of 0.0% q/q (vs our 0.4% forecast). Gross deliveries amounted to 8.1m dwt (7.0m dwt), while the 7.0m dwt scrapped surpassed our aggressive 5.0m dwt forecast. Newbuilding contracting during the quarter was 5.3m dwt (4.3m) with the orderbook now standing at 13% of the fleet, which is on par with the lowest levels on record going back to 1997.
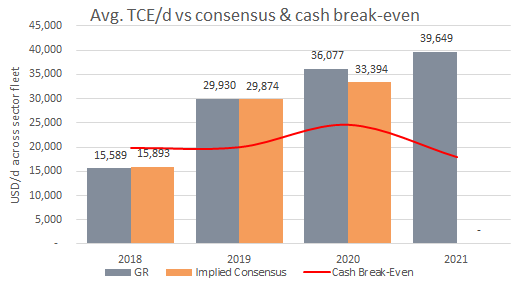
The implied demand contraction in 2Q was spot-on our forecast as OPEC quotas remained in place, -2.2% q/q (vs our -2.2% forecast) and -3.5% y/y (-3.6%). Thus, Oil Tanker spot rates averaged $7,831/d ($7,586) with the VLCC average $5,301/d ($9,452).
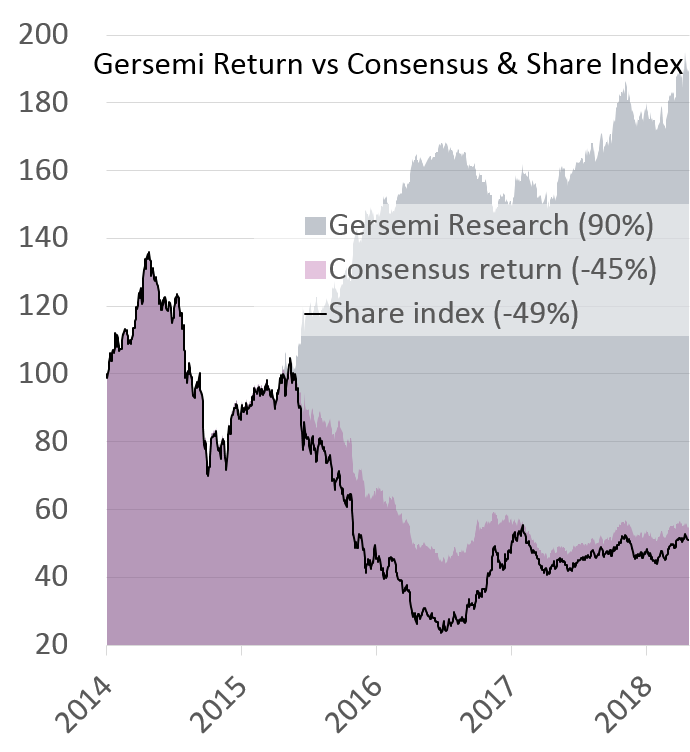
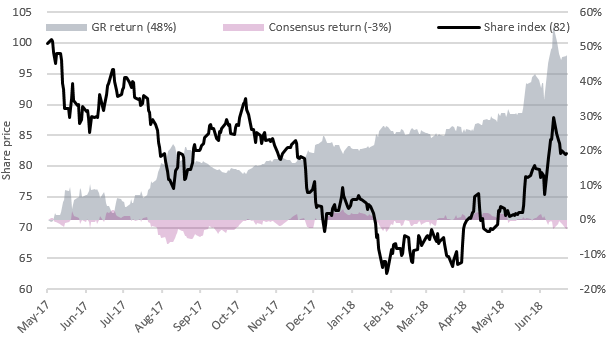
Since we upgraded the Oil Tanker sector to BUY in our 8 May 2018 report Time To Tank Up, shares have on average risen 17%. Since our re-initiation of the Oil Tanker sector about one year ago, we have 48% return on our recommendations vs the market at -18% and consensus at -3%.
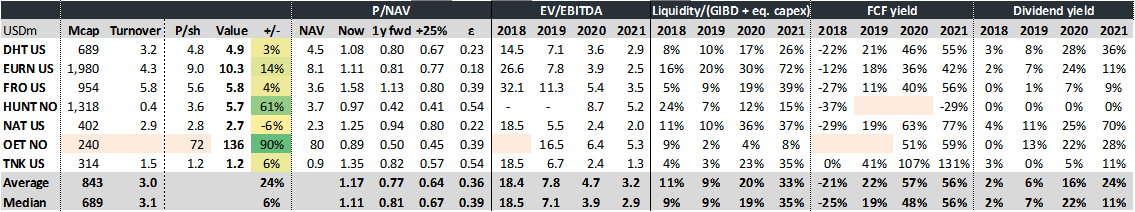
Peer Table:
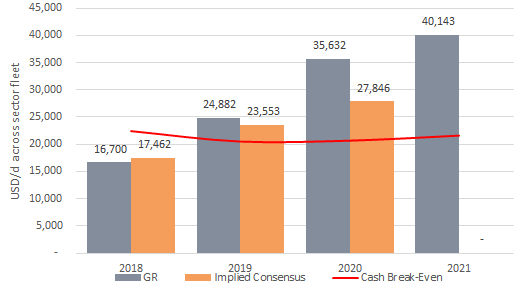
Gersemi TCE/d Forecast vs Consensus:
Dry Bulk (BUY): Spot rates spot on our forecast
Net supply growth of 0.7% q/q in 2Q18 was very close to the 0.5% forecast from our March report Enough Dry Powder Left for the Next Boom, with y/y growth at 2.1% (vs our 2.2% forecast). Gross deliveries of 6.7m dwt was below our forecast (8.7m), offset by only 0.6m dwt scrapped (4.4m). The really good news was the low contracting during the quarter at 2.6m dwt (9.2m), net reducing the orderbook.
The implied demand growth q/q was 1.3% (vs our 0.3% forecast) and 4.2% y/y (3.5%). The Baltic Dry Index (BDI) average at 1,201 was spot on our 1,165 March forecast, similar to Capesize spot rates which averaged $14,980/d ($15,121). The value of a five year old Capesize inched slightly above our forecast at 35m (34m).
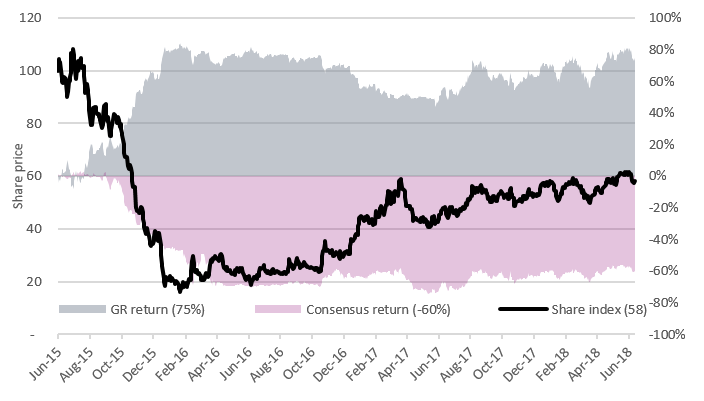
Since our first stand-alone SELL recommendation on Dry Bulk in 2014, we have 75% return on our recommendations vs the market at -42% and consensus at -60%.
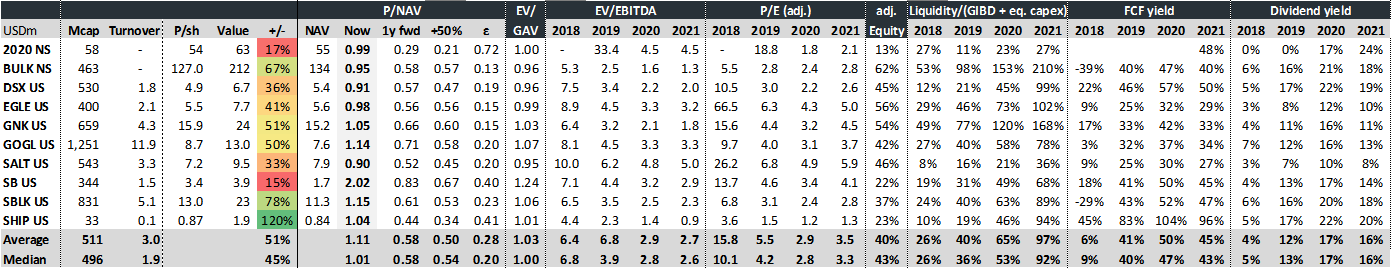
Peer Table:
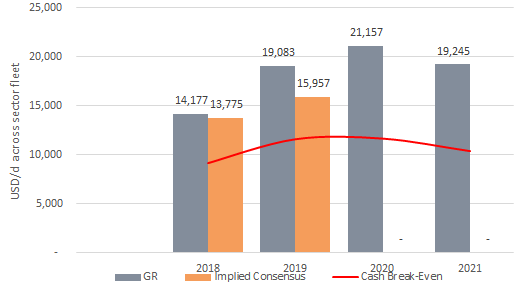
Gersemi TCE/d Forecast vs Consensus:
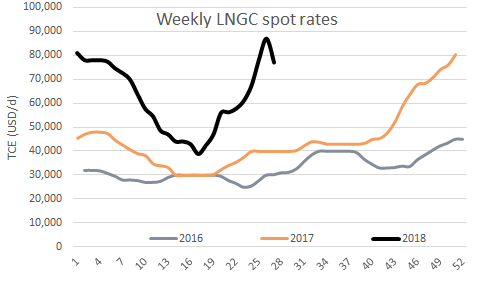
LNG Shipping (BUY): Massive demand growth
Net supply growth of 2.0% q/q in 2Q18 was below the 4.3% forecast from our April report The Best Is yet to Come with y/y growth at 9.8% (vs our 11.5%% forecast). Gross deliveries of 1.7m cbm was far below our forecast (3.3m), but primarily as deliveries slipped into 2H18 and not due to cancellations. Two old LNG Carriers were scrapped in 2Q vs our forecast of one, and only 0.7m cbm was contracted (1.2m).
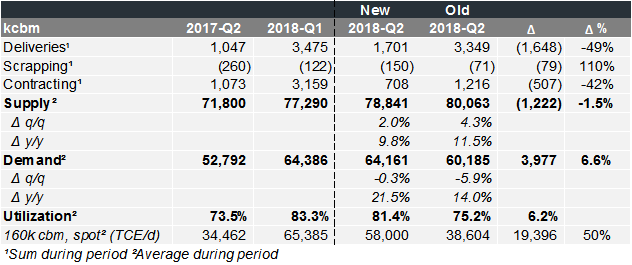
The implied demand contraction of -0.3% q/q was far above our -5.9% forecast with growth of 22% y/y (14%). The unseasonally strong demand has been driven by high demand for energy and low inventories in the Far East and will likely lead to a upwards revision of our current $48k/d 3Q18 forecast. LNG Carrier spot rates averaged $58k/d in 2Q18 ($39k/d).
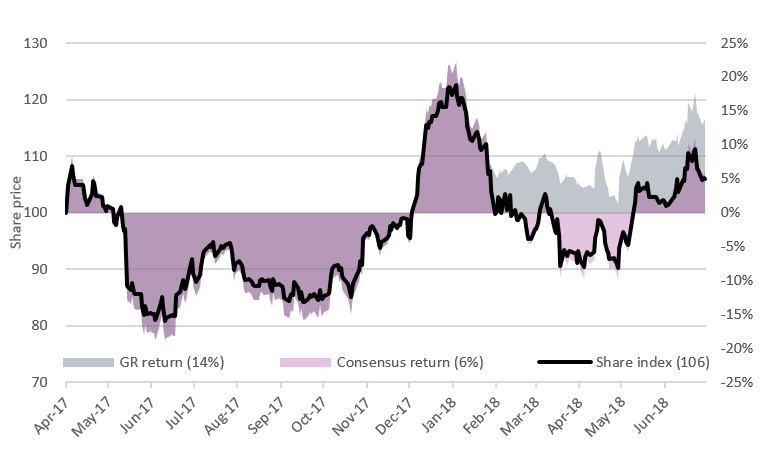
Since our re-initiation of LNG shipping last year, we have generated a 14% return on our recommendations vs the market and consensus at 6%.
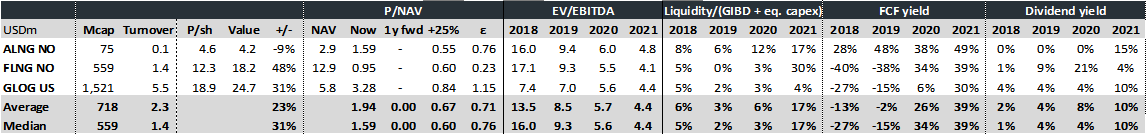
Peer Table:
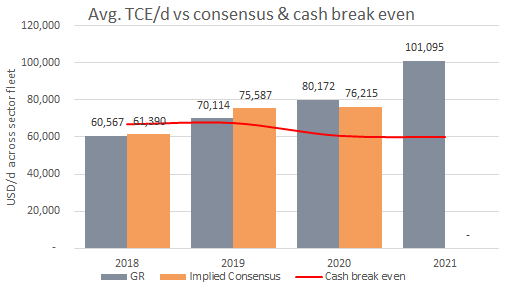
Gersemi TCE/d Forecast vs Consensus:
LPG Shipping (BUY): Negative supply growth
In a rare occurrence, net supply contracted 1.1% in 2Q18, even below our -0.2% forecast from our April report Do Not Liquidate Palatable Growth, with y/y growth at 3.6% (vs our 4.4% forecast). Gross deliveries of zero was below our 83k cbm forecast due to slippage, while scrapping of 235k cbm (117k cbm) was the highest in any quarter since 2Q 2007(!).
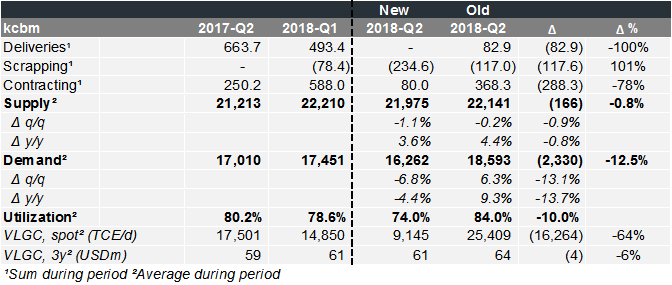
However, implied demand contracted even more at -6.8% q/q (vs our +6.3% forecast) and -4.4% y/y (9.3%). The main reason behind our massive miss was that the expected seasonal uptick (usually commencing between April to July) did not materialise in 2Q, but we do see encouraging signs at the time of writing with rates around $20k/d in the East (+425% from the trough in April and +102% y/y).
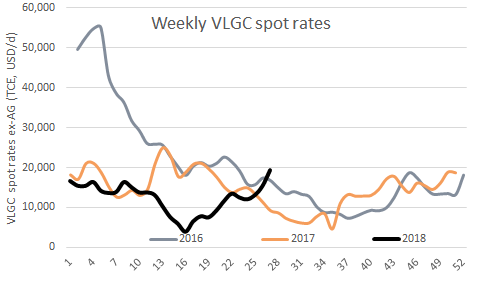
VLGC spot rates averaged $9k/d in 2Q18, far below our $25k/d forecast. A positive side-effect of the lackluster 2Q18 was contracting of only 80k cbm (368k), partly the reason for why we significantly increased our utilization forecast for 2020/21 last week in our 27-page LPG shipping report Trump’s Total Trade War.
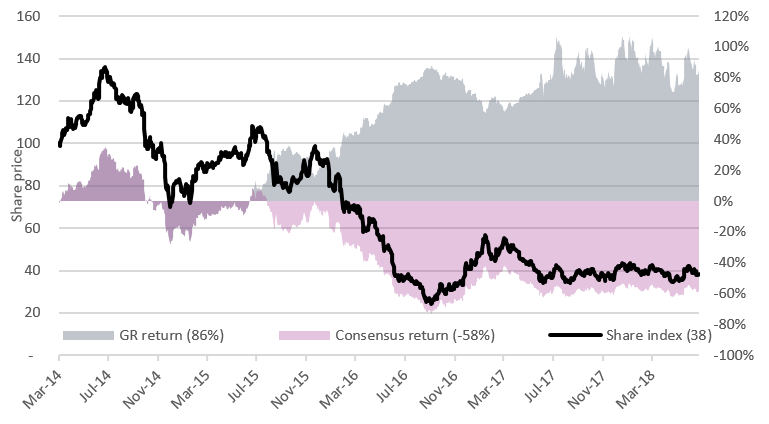
Since we started covering VLGC shipping shares in 2014, we have 86% return on our recommendations vs the market at -62% and consensus at -58%.
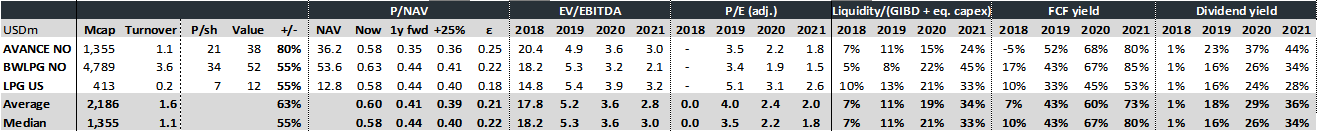
Peer Table:
Gersemi TCE/d Forecast vs Consensus: